

Typical Run Score
80
Great
Typical April running conditions in Buenos Aires, and a live Run Score so you can see how today compares with the norm.
 Works with Apple Health
The app
Every hour gets a Run Score. On this Austin day the best was 7 am at 94.
Tap any hour: what's against you and how much slower the same effort runs.
Widgets and a morning alert, no app to open.
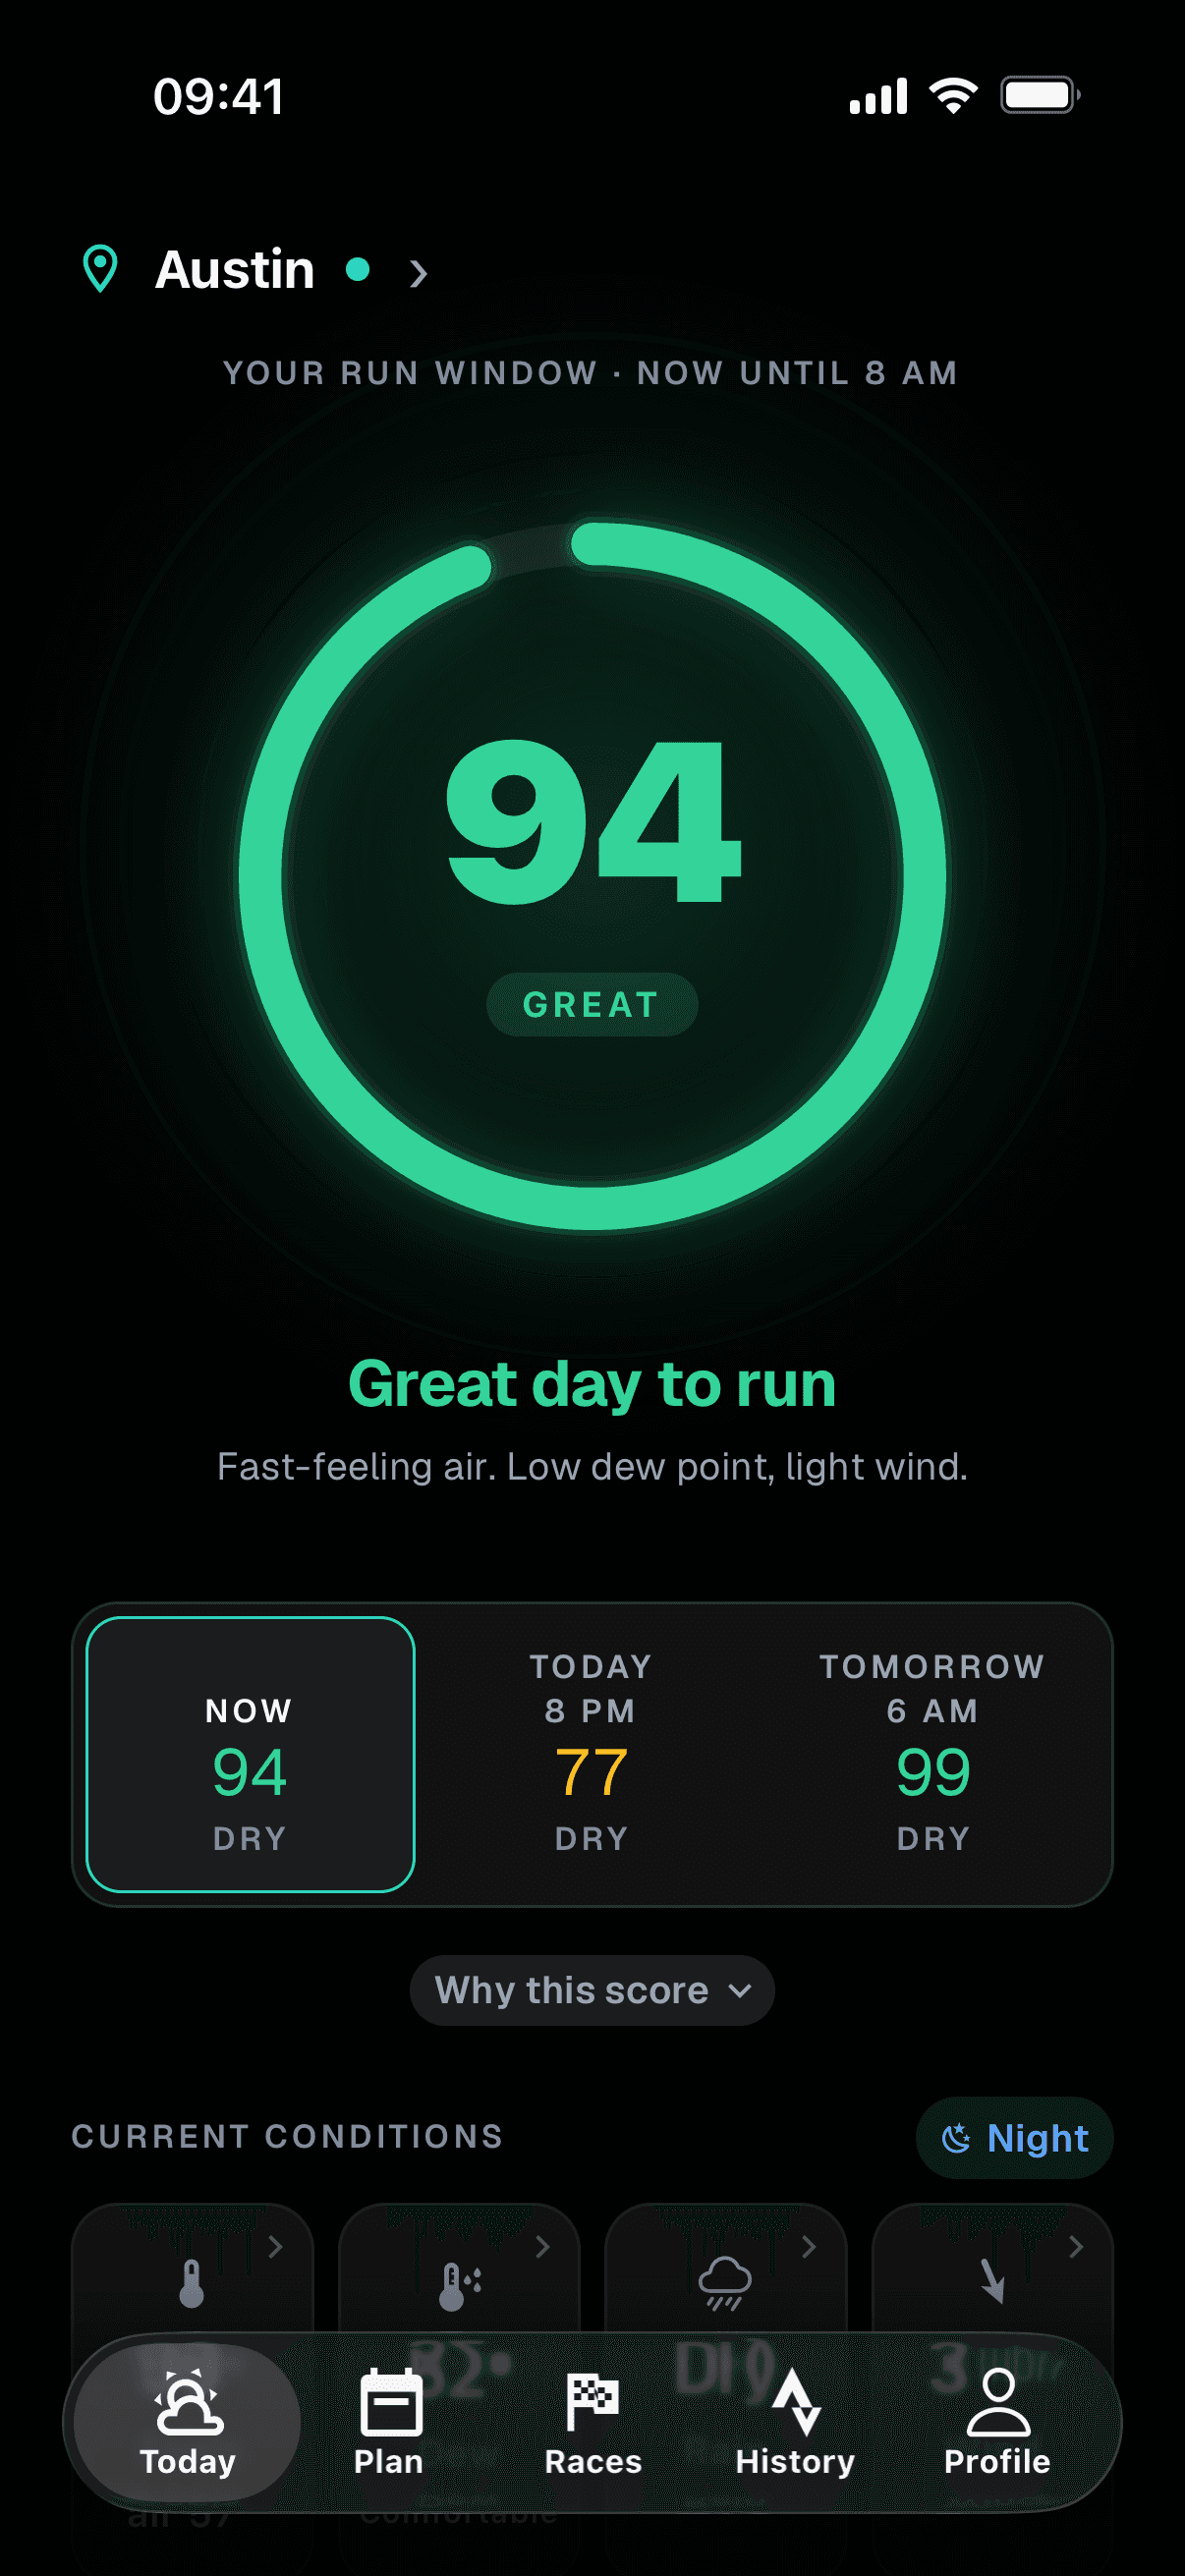
7 am · score 94
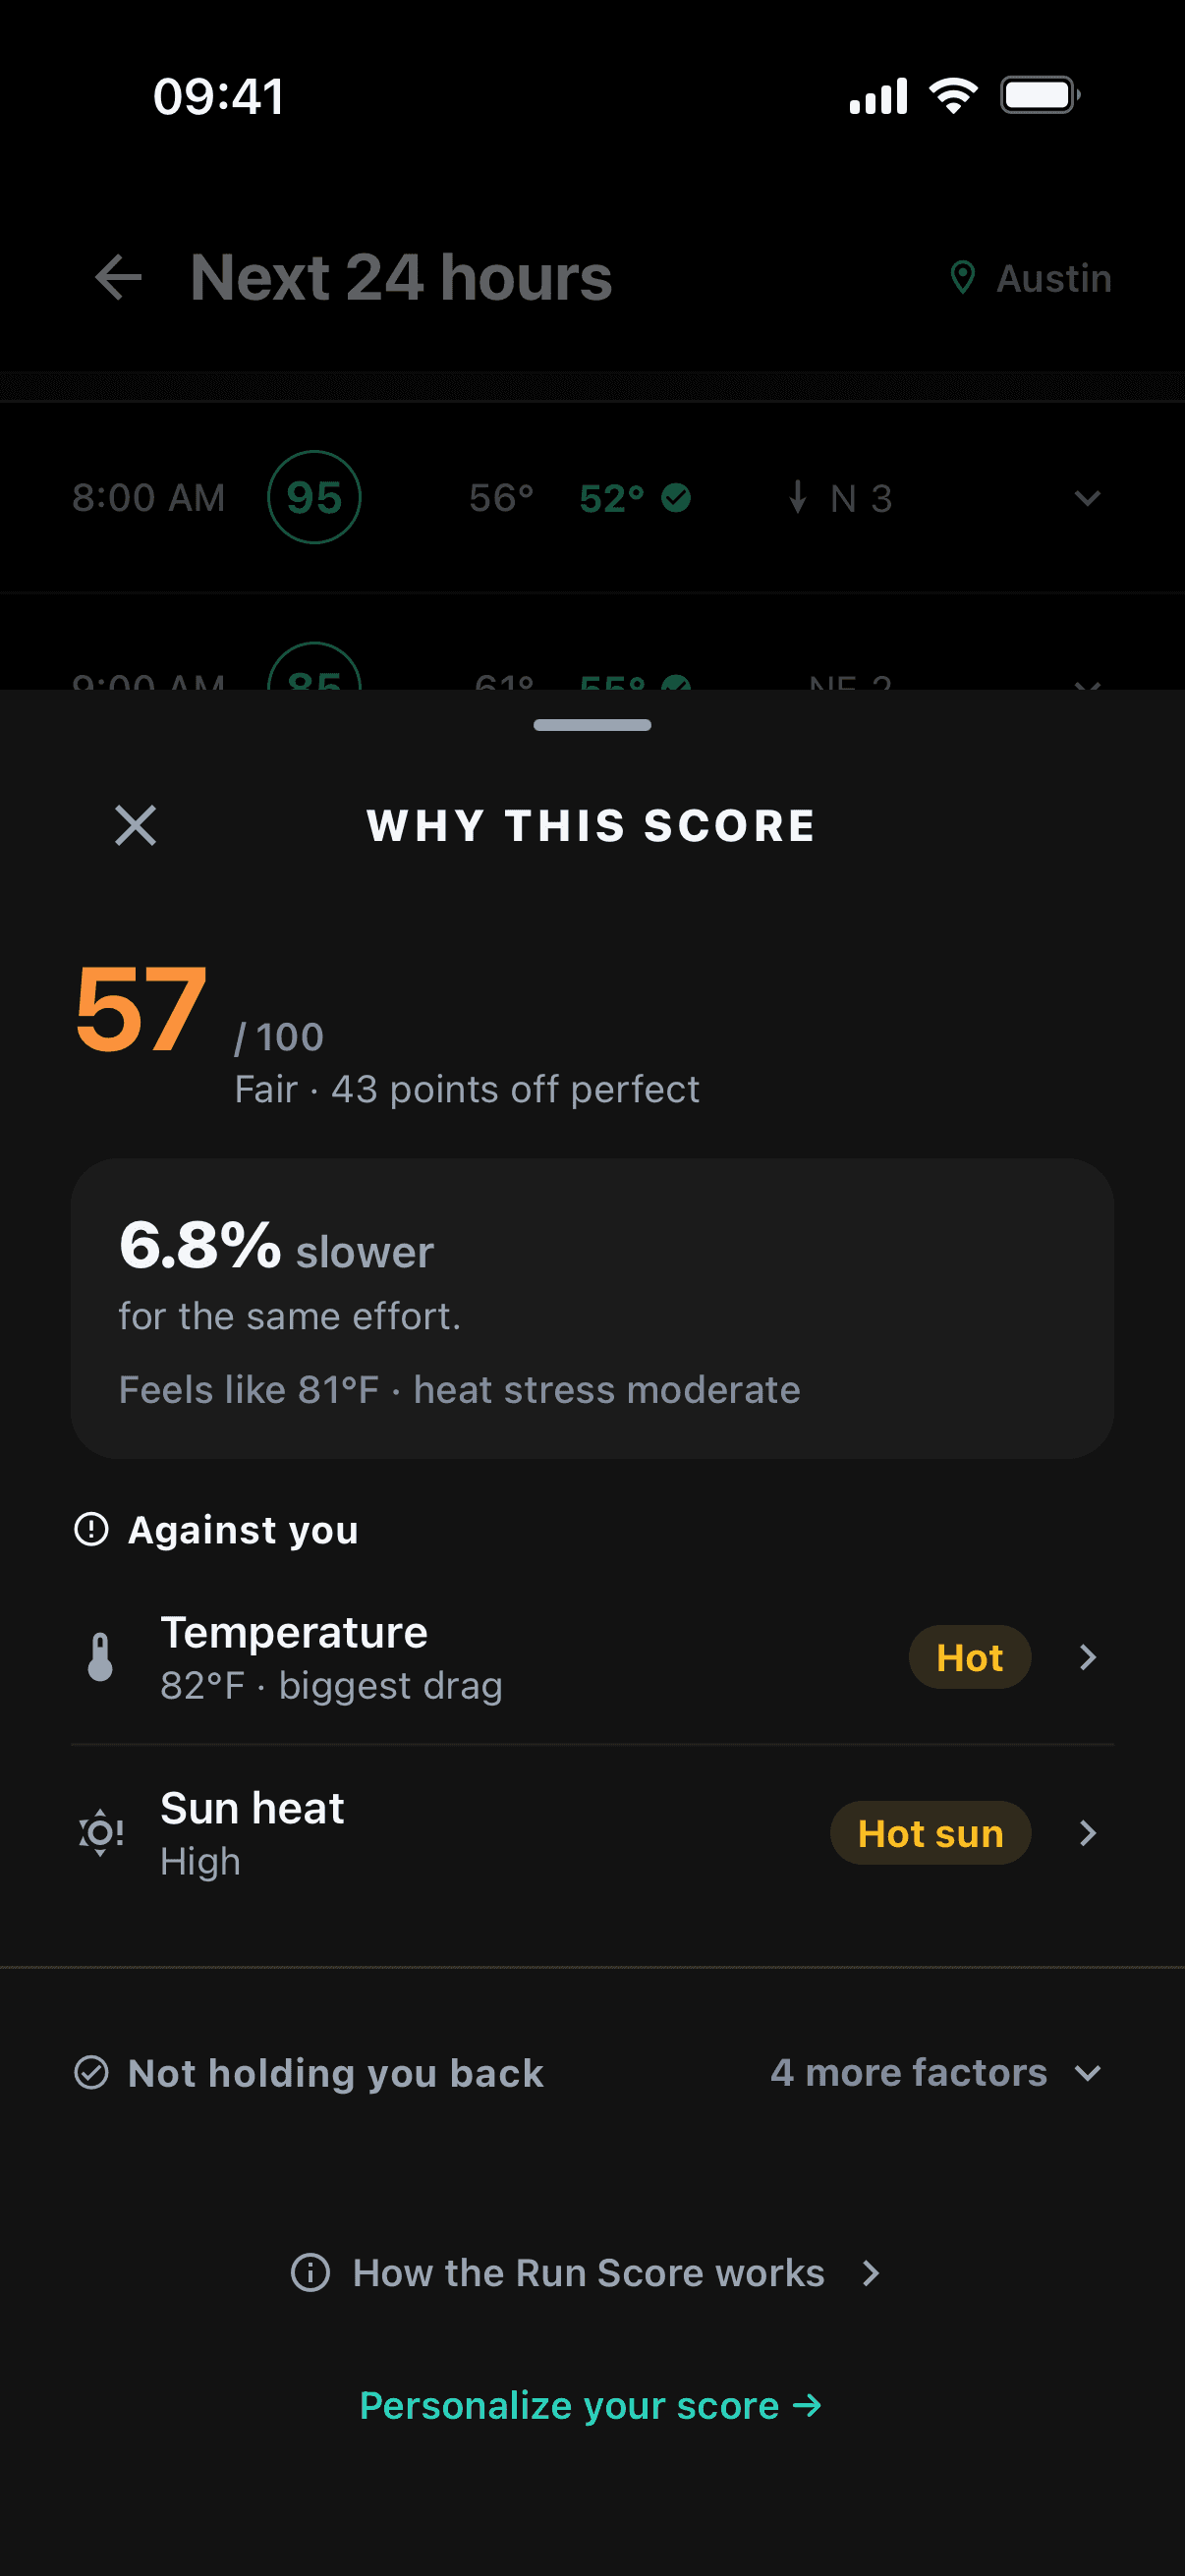
3 pm · 6.8% slower
Typical Run Score
80
Great
Avg temperature
64°F
Warm
Avg dew point
56°F
Pleasant
Best window
6–10 AM
Local time
April ranks 6th of 12 months for running in Buenos Aires, with a typical daytime Run Score of 80 (Great). For reference, the best month is June (score 90) and the hardest is January (score 56). The kindest window in April is typically 6–10 AM. Precipitation falls in roughly 12% of hours this month. Use the live tool below to see how today actually compares with the April norm.
Climate data by Open-Meteo.com, from Copernicus ERA5 reanalysis, hourly 2022–2024 (CC BY 4.0). RunWeather computed the Run Scores, best windows and monthly averages from it.
By city
More
Temperature. Performance peaks near 50–54°F. Every degree above that works your cooling system harder and slows the pace you can hold at the same effort.
Dew point. The real humidity signal. Above ~60°F dew point, sweat stops evaporating efficiently: the single biggest hidden driver of a hard summer run.
Wind. Sustained wind and gusts feed drag and thermal estimates. This public calculator uses a default route-exposure assumption because it does not know your running direction.
Heat stress. How hard heat, humidity, sun, and wind hit your body, combined into one number (wet-bulb globe temperature), the same metric race directors use to flag risk.
Solar exposure. Direct radiation on a shadeless route can feel far hotter than the air temperature. Cloud cover and sun angle are factored in.
Precipitation. Rain probability and intensity affect footing, comfort, and gear, weighted by how likely it is during your window.
Air quality. US AQI is folded in so sensitive runners get a clear signal when particulates make hard efforts a bad idea.
Pace adjustment. The output you actually use: how many seconds per mile to ease off today so your effort (not the clock) stays honest.
Enter your city. Search any city worldwide. RunWeather pulls the live local forecast: temperature, dew point, wind, sun, and air quality.
Get a 0–100 Run Score. One number that blends performance, safety, and experience (labeled Great, Good, Fair, Tough, or Poor) for the current hour.
Scrub the next 12 hours. Tap any hour to rebuild the full breakdown for that start time, or jump straight to the best window today.
Need a pace target for the heat instead? Try the heat and humidity pace calculator.
Yes, it's one of the better months to run here. The typical daytime Run Score is 80 (Great), with temperatures around 64°F (18°C) and pleasant dew points. The best window is usually 6–10 AM.
Typical temperatures average 64°F (18°C) (Warm) with dew points near 56°F. Dew point (not the thermometer) usually decides how hard the run feels.
Scores run 0–100. 80–100 is Great (97+ earns a gold star for near-perfect conditions). 65–79 (Good) is solid. 55–64 (Fair) or 45–54 (Tough) means at least one factor (usually heat or dew point) is slowing you. Below 45 (Poor), expect a noticeably harder effort or hold back for safety.
Your body cools by evaporating sweat. When the dew point climbs above roughly 60°F, the air is too saturated for sweat to evaporate efficiently, so heat builds up even if the thermometer looks reasonable. That's why a 70°F muggy morning can feel harder than a dry 80°F afternoon.