How We Price Race-Day Weather, and the Two Things We Got Wrong
What goes into the weather number on a RunWeather race plan, the two mistakes we found by checking it against real race results, what we changed, and how it now scores on 23 marathons.

Short answer
Our race plan prices weather from the heat a runner meets over their own hours on course, the drag of steady wind, and the sun counted inside the heat reading. We checked it against goal-matched results from 23 marathons. Before Berlin 2026 it priced a mild morning at about twice the published evidence, and it was charging the sun twice. After both fixes it reads 0.95 of what 4:00 runners actually gave up, and 0.93 on hot, sunny days. Fast and slow goals are still priced about a quarter too high.
Every RunWeather race plan carries one weather number: how much the day's conditions should add to your goal time if you run at an even effort. A number like that is only worth anything if you can see how it is built and how often it is wrong. So here are both. What goes in, the two mistakes we found by checking it against real race results, and how it scores now.
What goes into the number
Heat over your own hours on course. We read heat as WBGT, a single figure that folds air temperature, humidity, sun and the cooling of wind together. The race plan reads it for every hour you are on the course, not just the start. A 3:00 runner in Berlin is done before the city warms up. A 5:00 runner is still out there at lunchtime, two hours later, in different weather. Same race, different conditions, so a different number.
Steady wind. Running into wind costs effort, and the plan prices the drag from the sustained wind speed. Gusts are a separate warning, not part of the number.
The sun, once. Sun lands inside the heat reading: WBGT goes up in full sun and down under cloud. The plan uses the forecast's own sky for each hour, so a clear morning and an overcast one at the same temperature come out differently.
What is not in it. Rain is not priced. The plan tells you it is coming, and that is all. The number is also not built from your own runs: it comes from how large marathon fields slowed in past heat, applied to your goal and your hours on course. More on why below.
We anchor the curve on El Helou and colleagues (2012), who studied 1.79 million finishers across six big marathons. For runners around 3:30, they found about a 3.4% slowdown at 16°C, close to 8% at 21°C, against a best day near 6°C. That is the shape any race weather number should land near.
Mistake 1: Berlin 2026, a mild morning priced like a warm one
Four days before Berlin, we opened our own race plan. Forecast: 13°C at the start, about 19°C by the finish, dew point 9°C. The temperature tile read IDEAL. The plan said the weather would add 15 minutes 9 seconds to a 3:30 goal, 7.1%, which is about 21 seconds per kilometre on a 4:59/km pace.
The published evidence for that morning sits around 3.5%, roughly 10 seconds per kilometre. We were at about twice that.
The cause was a straight line. Our heat cost started climbing in a straight line from the ideal temperature. Race data does not look like that: it is nearly flat just past ideal and steepens later. So we bent the curve near the ideal and left the hot end exactly where it was. A mild morning now costs close to what the papers say, and a hot day costs what it did before.
What happened on race day: matched runners at a 4:00 goal gave up 3.3%, about 11 seconds per kilometre on a 5:41/km pace. The curve we run today, fed the weather that actually happened, says 3.4%.
Mistake 2: the sun, counted twice
Next we lined up humid race days against what runners actually lost, and they came in at about half of what we priced. That looked like humidity, so we turned humidity down.
That was the wrong lever. On the races we had, the humid days were also the hottest days, so we could not tell "too much for humidity" from "too much for heat". To split them, we added 14 race-years picked on purpose: hot but dry days (Boston 2003, 2004, 2005, Berlin 2026, London 2018) and mild but humid ones.
If humidity were the whole story, the hot, dry days would have landed right on the model. They did not. They read about 0.60 of our number, as overpriced as the humid days had been.
The reason was in the code. Sun was priced inside the heat reading, and then priced again as a separate sun term from the same sunlight. On those hot, dry days, the heat part alone matched what runners lost. The sun term was the overcharge (4:00 goal, percent of finish time):
| Race | Air / dew point | Runners lost | Heat part | Extra sun term |
|---|---|---|---|---|
| Boston 2004 | 27°C / 11°C | 12.3 | 12.1 | 3.6 |
| London 2018 | 22°C / 12°C | 8.7 | 7.8 | 3.2 |
| Boston 2017 | 22°C / 5°C | 6.6 | 6.3 | 2.6 |
| Boston 2005 | 21°C / -4°C | 5.0 | 3.4 | 3.5 |
| Berlin 2026 | 18°C / 9°C | 3.3 | 2.6 | 1.0 |
So race pricing now counts the sun once, inside the heat reading. The humidity setting stayed: with the double sun gone, the data still prefers it where it is.
How it scores now
The check: 23 marathon race-years (Berlin, Boston, Chicago, London, New York and Twin Cities), each a hot or humid year compared with cooler years of the same race. For each goal time we take the runner at the same place in the field, say the one finishing at the 4:00 share of a cool year, and see how much slower the runner at that same share was in the test year. That is what runners lost. Then we compare it with what our race curve says for that day's weather, hour by hour.
A score of 1.00 means we priced it right. Below 1 means we priced too much. The score is a best-fit scale across the races, so the hottest days weigh more, and it can sit a point off what you get by dividing two averages.
| Goal | All 23 races | 4 hot, sunny races |
|---|---|---|
| 3:00 (4:16/km) | 0.75 | 0.72 |
| 4:00 (5:41/km) | 0.95 | 0.93 |
| 5:00 (7:07/km) | 0.78 | 0.73 |
At 4:00 on the hot, sunny days, runners lost 8.1% on average, about 28 seconds per kilometre, and we price 8.6%.
Row by row at 4:00:
| Race | Runners lost | We price |
|---|---|---|
| Boston 2004 | 12.3% | 14.2% |
| London 2018 | 8.7% | 8.6% |
| Boston 2017 | 6.6% | 6.7% |
| Boston 2005 | 5.0% | 4.8% |
| Berlin 2026 | 3.3% | 3.4% |
| Boston 2003 | 3.5% | 5.6% |
Where it is still wrong
- Fast and slow goals are still priced about a quarter too high. 0.75 at 3:00, 0.78 at 5:00. Whether the curve should change with goal pace is an open question we have not answered yet.
- Boston 2003 is overpriced. Runners lost 3.5%, we say 5.6%. That race hinges on the weather station: inland Norwood read 19°C, Logan airport on the water 11°C, with a sea breeze over the last ten miles.
- One race is noisy. The same race in two cool years can differ by about 2.5 percentage points at 4:00. On a mild day that is as big as the whole weather charge, so no single mild race proves anything either way.
- Four hot, sunny races is a small set. All four are spring races, and the older Boston years had a single noon start, a different race from today's.
Another race weather site publishes the rules behind its own number, so we ran those rules through the same 23 races. They priced these hot spring days lower than what runners actually lost, which their own notes already flag: they say they are likely "too soft on the hottest early-season days." Different models, different trade-offs. We print ours so you can check it.
The thing we tried and dropped
We wanted the number to be personal: price heat from each runner's own heart rate on hot training days. We tested it on 33 runners with enough hot runs. Only 3 stood out, which is about what chance alone produces, and even with 50 hot runs behind a runner, the range on their own number was too wide to use. So we dropped it and removed the code. The number stays a field number, applied to your goal and your hours on course.
See it on a race
Each race page prices its typical race-day weather with this same curve:
For how heat and humidity shape everyday runs, not races, see how the Run Score works and our heat and humidity pace guide.
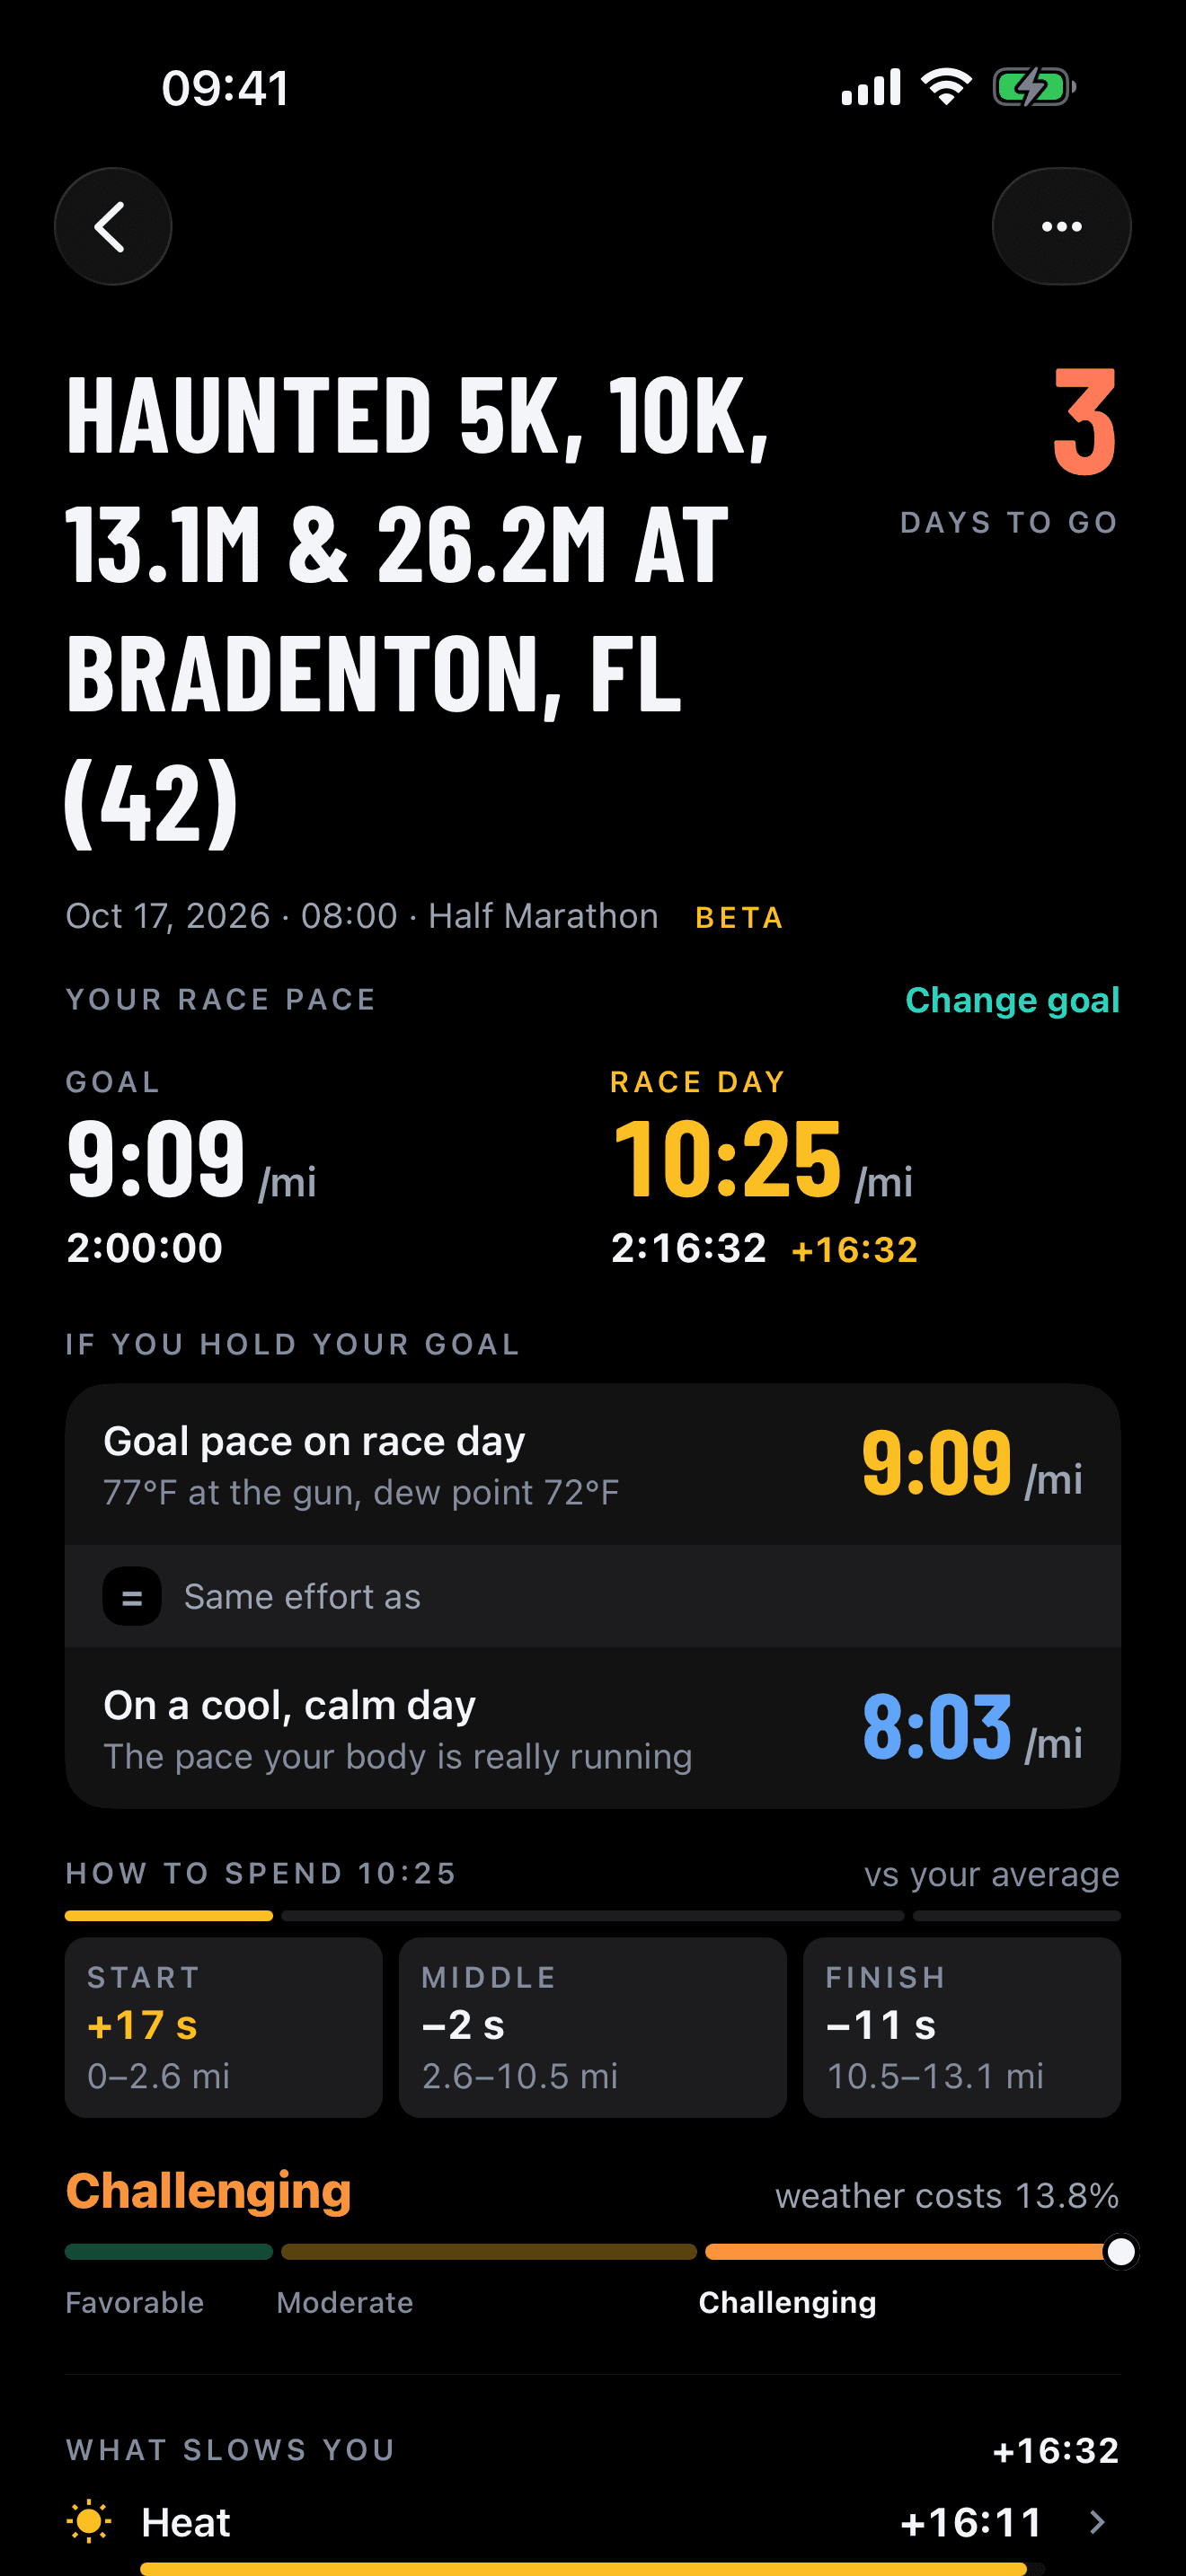
Your goal pace against race-day pace, on the race plan.
Frequently asked questions
What does the RunWeather race plan count in its weather number?
Three things. Heat, read as WBGT (air, humidity, sun and wind cooling in one number) for each hour you are on course, so a slower goal meets more of the late, warmer hours. The drag of steady wind. And the sun, counted once, inside the heat reading. Rain and gusts are not in the number; the plan warns about them separately.
Is the race weather number personal to me?
No. It is priced from how big marathon fields slowed in past heat, applied to your goal time and your hours on course. We tested pricing heat from each runner's own heart rate and dropped it: only 3 of 33 runners stood out from noise.
How accurate is it?
On 23 marathon race-years, at a 4:00 goal, runners gave up 0.95 of what the race curve prices, and 0.93 on the four hot, sunny races. At 3:00 and 5:00 it still prices about a quarter too high. Year-to-year noise in a single race is about 2.5 percentage points, as large as the whole weather charge on a mild day.
What did you get wrong?
Two things. Before Berlin 2026 our curve rose too steeply just past ideal weather, so it priced a mild morning at about twice the published evidence. And it charged the sun twice: once inside the heat reading and again as a separate term. Both are fixed.